Enhance Your Power BI Skills: Combine Multiple Datasets
Power BI is a powerful tool for transforming data in (visual) information. As of today you have perhaps built your first dashboard, and are enthusiastic about the insights that dashboards provide to you. You transformed an Excel sheet in a beautiful Power BI dashboard. You, your colleagues or your superiors see the added value and come up with all kinds of new ideas for additional ideas and insights. However, this requires adding new datasets to your dashboard, and possibly combining multiple datasets. This article tries to explain you how you can best achieve this, without using any programming code. So, to use a popular phrase nowadays: a no-code solution! Only interested in the final result? Please find the Power BI dashboard here.
Initial consideration
Before we dive into Power BI, an important consideration needs to be made first. In order to combine multiple datasets, a common denominator is required. For instance, a Client ID or a Date. Which identifier you chose depends on the question you need to ask yourself before you start building: what insight do you want to achieve? For instance, you have built a Power BI dashboard that shows you the country distribution of your investment portfolio that replicates a global equity portfolio. This dataset is coming from a csv file that is produced for you, or sourced from an (external) source like a website or network drive. Now you consider to invest in an exchange-traded fund (ETF) that is focused on sustainability, and wonder how the composition of this new investment is compared to the global equity portfolio in terms of country, sector and overlap of securities. With Power BI you can create this insight intuitively using tables and graphics. The common denominator between the two datasets in this case is the Security ID, since this is the lowest level of data that is present in both datasets (more later on).
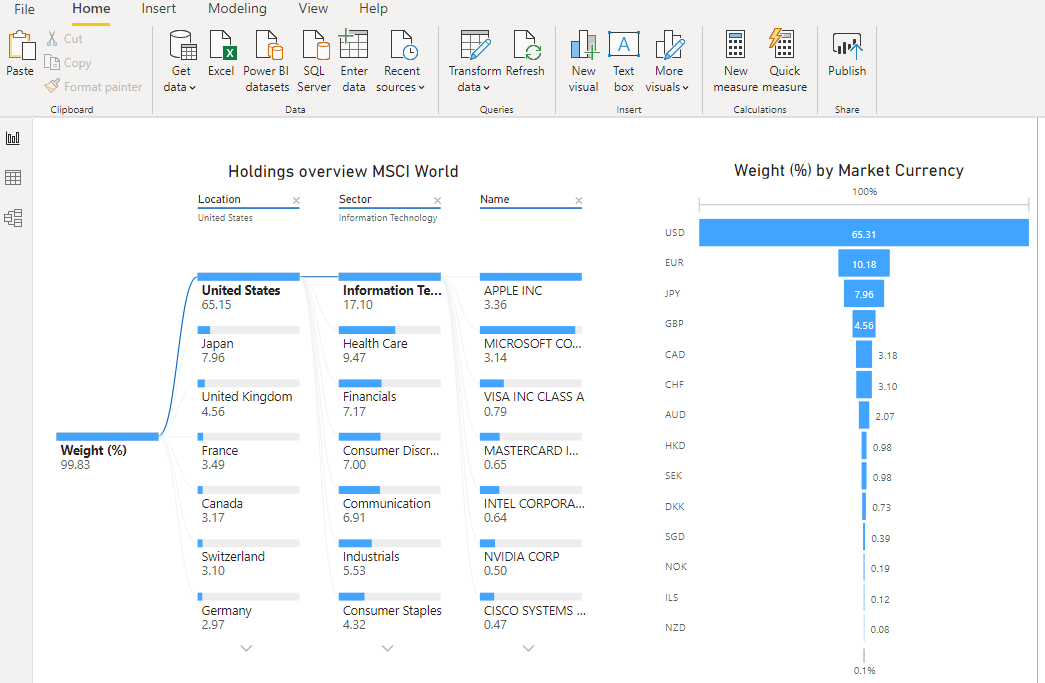
As a starting point, we use a dashboard with a single dataset. Please find this dashboard here. It is a basic dashboard that shows the country and sector exposure of the MSCI World at June 5th, 2020, which is a global equity index. The dataset used is sourced from iShares, a company that offers ETFs that replicate indices. The holdings can be downloaded from their website and contains, amongst others, the Security ID, holding name, holding weight percentage, sector and country. A minimum amount of data manipulation is required before this dataset is ready to be used in Power BI, given that the dataset is pretty well organized. The only change made is removing the top 2 rows and promote the resulting first row as header.
Add the second dataset
Then, we are interested in investing in a sustainability focused index and wonder how this index diverges from the global equity index. As a replicate of a sustainability focused index, we consider the VanEck Vectors Sustainable ETF. On the website of VanEck the holdings can be downloaded as an Excel file. However, this file contains a minimum of columns, and is therefore less extensive than the iShares file. Fortunately there is an identifier column, which is quiet similar to the identifier column of the iShares file, except that VanEck data includes the location of listing (e.g. TSLA US), whereas the iShares file does not (e.g. only TSLA). This requires some data manipulation before we can merge the two data files in Power BI, which will be explained in the next paragraph.
We first need to add the VanEck data file as a new data source by clicking on ‘Get data’ on the Ribbon in Power BI. Then, choose Excel, click on Connect and select the Excel holdings file downloaded from the VanEck website. You will then probably get an error message that the file cannot be loaded. The strange thing is that the Export from the VanEck website gives an .xls file, whilst the content is an HTML table. To solve this, click in the error message window on ‘Edit’, and select ‘Html page’ in the ‘Open file as’ dropdown box. In the next window, select ‘Table 1’ and then ‘Transform data’. You will now go to the Power Query Editor, which is a powerful tool to manipulate data to your needs.
Data manipulation required
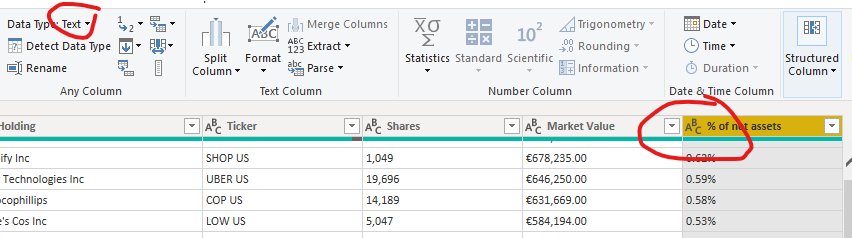
In order to get the data ready to merge with the iShares dataset, we first need to clean the dataset. To start, remove the first row as this is a description row. We can do this by clicking on ‘Reduce Rows -> Remove Rows -> Remove Top Rows -> fill in 1 as the ‘Number of rows’ in the ‘Home’ tab of the Ribbon. Next, promote the first row as header, by clicking on ‘Use First Row as Headers’ in the ‘Transform’ tab of the Ribbon. Then, looking at the dataset, we see that we do not need the first column, which is a Number column. You can remove this by right clicking on the column header, and then ‘Remove’. Then, it is important to look at the Data Type of the columns. In below screenshot, you will see that the ‘% of net assets’ column, which is an important column for our goal given that it represents the weight of an investment in the portfolio, is currently set as a Text column. If we keep it this way, calculations based on this column will not be possible later on. Therefore, change the Data Type to ‘Percentage’, by clicking on the ‘Data Type’ box in the ‘Transform’ tab of the Ribbon. Do this for all the remaining columns.
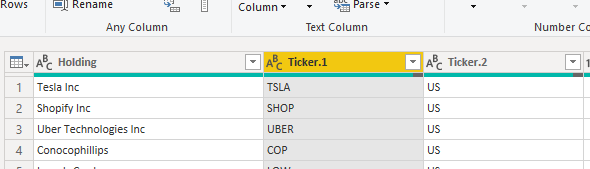
Then, the final data manipulation step, and this is maybe the most challenging one. As mentioned earlier, the common denominator is the Security ID. In the case of the iShares dataset, the column name of the Security ID is ‘Issuer Ticker’, whilst for the VanEck file it is ‘Ticker’. The difference in naming is not a problem, although I advise have similar column names. The challenge is that the Security ID for the VanEck file includes the location ID, whilst the iShares does not. In order to have both datasets aligned, split the location ID from the Security ID. The split can be done by splitting on the space character. To do this, right-click on the column ‘Ticker’ of the VanEck file, and select ‘Split Column->By Delimiter. Make sure that ‘Space’ is selected as delimiter, and click on OK. The result is that the column ‘Ticker’ is now split in ‘Ticker.1’ and ‘Ticker.2’. You may chose to change the names.
Final step
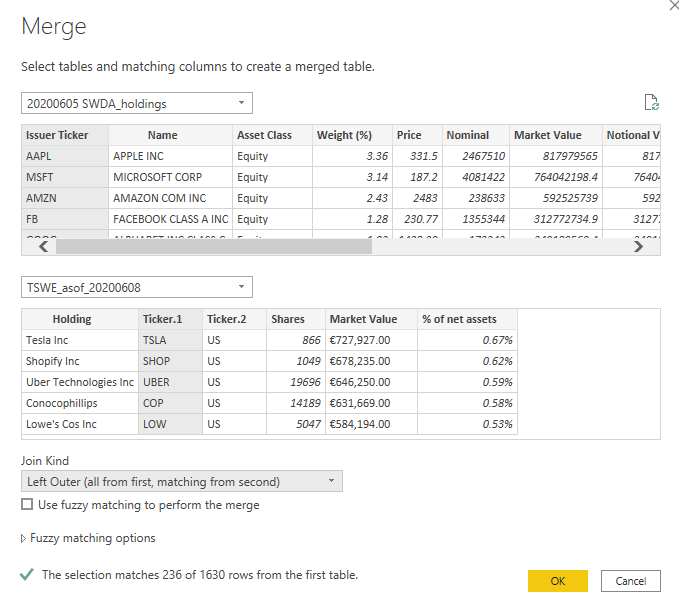
Finally, bring the data sets together by merging the two to a new query set. To do this, we remain in the Power Query Editor, click on ‘Merge Queries -> Merge Queries as New’ in the ‘Home’ tab of the Ribbon. In this window, make your selections based on below screenshot. Notice that I chose a Left Outer join. The consequence of this join is that any securities that are in the VanEck data file, but are not in the iShares file, will be excluded. This is done so on purpose, given that the VanEck data file lacks the information regarding country and sector. However, if you want to be complete, one can chose a Full Outer join. If choosing this option, you will need to do a little more data manipulation, which is too much to cover for now.
After clicking OK, you will see that a new query is made called ‘Merge1’. Also, you will see that on the far right side of the columns a special column is present, with two arrows in the column header. By clicking on the two arrows, you can select which columns from the VanEck file (in this case the right side of the join) are shown. For our purpose, we only need the ‘% of net assets’. So select this one, and you will see that a value is given in the cases that the security is present in both data files. In case the security is not present in the VanEck file, a ’null’ value is given. To avoid problems later on, in terms of error messages, get rid of the ’null’ values by replacing these values with zero (0). Right click on the column and select ‘Replace Values’. Fill in the text box of ‘Value To Find’ the value ’null’, and fill in 0 in the ‘Replace With’ text box. Then finally (yes, finally), please note that the weight values in the iShares file are based on whole percentages (so, 1% = 1), whilst the VanEck file is based on 100% (so, 100% = 1). To bring the two in line, add another column that multiplies the VanEck holdings percentage column with 100. To do so, go the ‘Add Column’ tab in the Ribbon and click on ‘Custom Column’. Then give the column a name, for instance Weight (%) VanEck, and fill in the formula [#"TSWE_asof_20200608.% of net assets"] * 100. Click on OK and you will see a new column appear. Make sure that the Date Type of this new column equals a ‘Decimal number’. To finish, click on ‘Close & Apply’ in the ‘Home’ tab of the Ribbon and you will be redirect to the Power BI editor.
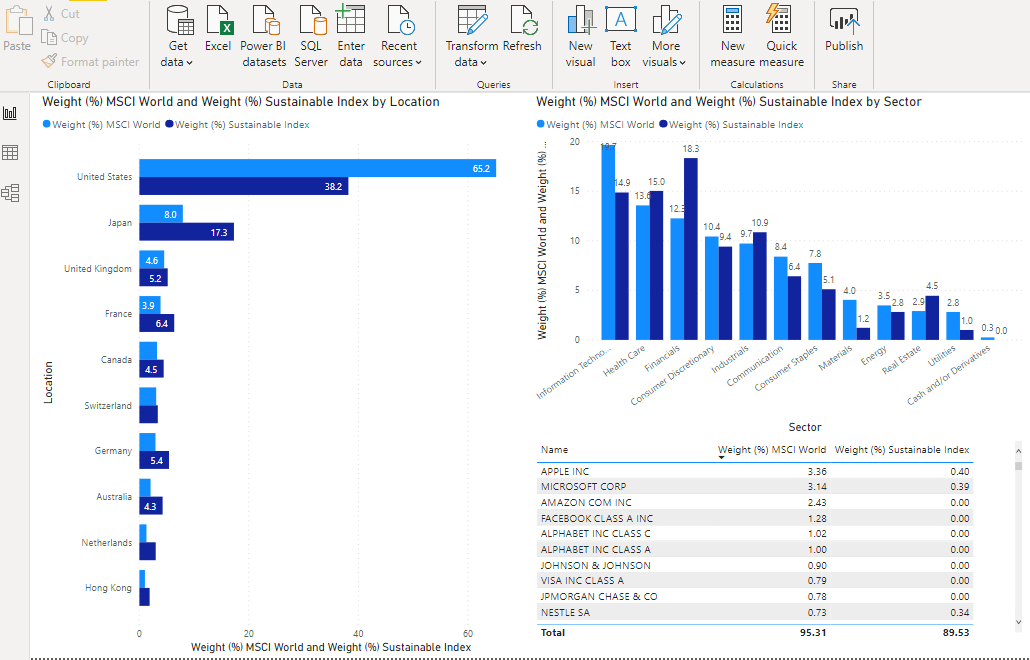
As end result, and as can be observed by the screenshot above, I have created a dashboard that shows you the difference between the two investments (or datasets). Notice the significant lower allocation to the U.S. and the Information Technology sector by the sustainable index. This is also represented by the absence of allocations towards large tech companies like Facebook, Alphabet (Google) and Amazon in the sustainable index.
Conclusion
Merging multiple datasets can be challenging, although if you practice a couple of times you will get the hang of it. Important lesson is that, before you begin building or extending your dashboard, ask and answer yourself the question: what insight do I want to achieve?
Disclaimer: Please do not consider this blog and the example funds used as an investment advice - as this is not - and solely consider this blog as a guide in how to merge two different datasets in a Power BI dashboard.